2014-06-26

Cassandra node token重複,又沒正確移掉導致一直出現幽靈node連上的log


= 情境 =
原本有一個3個node (A[127.0.0.1], B[127.0.0.2], C[127.0.0.3])的cluster ring,後來因為一個操作失誤,讓一個非預期的node D[127.0.0.4] 使用跟 C 一樣的token加入了這個ring。因為token 一樣,所以cluster會顯示node D取代node C成為這個token的擁有者,在發現了這個失誤之後,將node D給關掉,然後重開node C,讓node C再把token搶回來。結果之後Node C開始一直出現這樣的log(大約90秒一個循環):

INFO 2014-06-24 14:02:05,778 Node /127.0.0.4 is now part of the cluster
INFO 2014-06-24 14:02:05,779 InetAddress /127.0.0.4 is now UP
INFO 2014-06-24 14:02:05,779 Nodes /127.0.0.4 and /127.0.0.3 have the same token 113427455640312810000000000000000000000.  Ignoring /127.0.0.4
INFO 2014-06-24 14:02:15,281 InetAddress /127.0.0.4 is now dead.
INFO 2014-06-24 14:02:36,302 FatClient /127.0.0.4 has been silent for 30000ms, removing from gossip

這些log最讓人不解的是 Node D其實已經關掉了,但是他卻每隔一段時間又像幽靈一般連了上來,然後過沒多久又斷掉。在網路上追查之後,發現有隻issue應該跟這件事有關係: https://issues.apache.org/jira/browse/CASSANDRA-3736 ,以下大至整理一下這個問題相關的資訊。

PS. 以上情境是在Cassandra 1.0.12版發生的

= 解說 =
這件事情跟Gossip的運作息息相關,所以我們先來了解一下Gossip的protocol。 Gossip是cassandra node之間用來同步ring的狀態的一個機制,node之間透過Gossip protocol來同步所知道的node的狀態。每個node啟動之後,就會每秒一次,頻繁地選幾個已知的node做gossip(對一個全新的node來說,最一開始他會跟seed node做gossip),以知道ring的狀態。以下是個資訊簡化的一對一的gossip過程,實際情況每個node會同時跟幾個node做這個互動:


圖1. Gossip 流程

首先我們先解說一下圖例,上圖是兩個node 在交換Gossip資訊的過程,其中node裡面的框代表這個node所知道的 endpoint 的table(gossip 裡的endpoint指的就是一個node),這裡的endpoint的資訊是簡化過的,只寫出最重要的資訊,實際還有更多的資訊,這邊看到的資訊格式被稱作 gossip digest。一個 gossip digest 的格式大至有三欄位,分別是:  host、generation、version,這三個資訊用分號( : ) 分隔連成一個字串就是一個 gossip digest,例如 /127.0.0.1:1403669222:9  ,指的是這個endpoint的 host= /127.0.0.1 , generation= 1403669222, version: 9

其中host比較沒什麼疑問,指的就是該node的 hostname;而generation代表這個endpoint的 啟動的狀態,會隨著每次重新啟動而增加;而version則是由這個endpoint的各個資訊計算出來的一個version值,代表這個endpoint這次啟動之後的狀態的版本(隨著狀態的變化,版號會增加,版號越大代表狀態是越新的)。

接著我們分別解說gossip的流程:

第一格
發動的 node 1根據自己所知道的endpoint的table發了一個 GossipDigestSynMessage 的訊息,裡面會帶有所知道的endpoint的 gossip digest。 接收者node 2收到 GossipDigestSynMessage 之後,會跟自己的endpoint table做比較,透過比較generation跟version來了解自己所知的資訊是比送來的資訊新還是舊,以上圖的第一個步驟的狀況,node 2可以知道他所知的/127.0.0.1的資訊跟所收到的一致;而/127.0.0.2則他所知的較新;而送來的 /127.0.0.4 的generation比較大,可知 /127.0.0.4曾經重啟過;最後,/127.0.0.3跟 /127.0.0.5 都是 node 2不知道的node

第二格
node 2 根據比較的結果,發出一個 GossipDigestAckMessage ,若手上的資訊較新,就會把自己所知道的該endpoint的所有資訊付上;若自己不知道、或是手上的資訊較舊的,就把該gossip digest的version改成0送出。而node 1在收到 GossipDigestAckMessage 之後,就會更新手上較舊的 endpoint 的資料,接著看自己手上的endpoint的版本是不是比送過來的 gossip digest還新,而因為送回來的gossip digest的version都是0,所以手上有的資訊都會被認為較新…除了 /127.0.0.5 這個node,這個node自己手上的資訊一樣是 /127.0.0.5:0:0 ,代表我們兩個知道的一樣。

第三格
node 1再根據 GossipDigestAckMessage 的比對結果,將更新的endpoint的資訊用 GossipDigestAck2Message 訊息傳給 node 2,如此一來node 2就可以去更新手上的資訊。其中,而 /127.0.0.3 這個endnode在這個時侯才被加入了node 2所知的 ring,因此在node 2會出現以下的 log:

INFO 20yy-MM-dd hh:mm:ss,SSS Node /127.0.0.3 is now part of the cluster
INFO 20yy-MM-dd hh:mm:ss,SSS InetAddress /127.0.0.3 is now UP

第四格
代表做完一輪 gossip 之後,兩個 node的狀態,對於有generation、version的endpoint,雙方的資訊同步了,而對於 /127.0.0.5,兩個node在這次啟動之後,都沒看過這個node,所以最終這個node的還是只有 node 1知道。

以上是 gossip的流程,這個流程中,跟我們一開始的問題有關的主要是第三格的部份,node 2會印出我們看到的 log,這個log看似好像有個新的 node(/127.0.0.3)跟node 2連上了,但是實際上只是gossip的交換資訊的過程中,node 2知道了一個新的node,它會相信gossip所傳來的訊息,認為 /127.0.0.3 是活著的,接著才會嘗試跟 / 127.0.0.3 做通訊。而假設 /127.0.0.3 實際並沒有開著的話,過一段時間的連線嘗試,node最終會認定 /127.0.0.3 是死的,就會出現以下的log

INFO 20yy-MM-dd hh:mm:ss,SSS InetAddress /127.0.0.3 is now dead.

出現這行log的之後,gossip還是一直持續收發,有關該node還存活的謠言還會繼續流傳,這時侯node 2會暫時不理會任何有關 /127.0.0.3 還活著狀態消息(這個持續的時間被稱為QUARANTINE_DELAY,他的值會等於 cassandra.ring_delay_ms 的兩倍),如此一來,假設 /127.0.0.3 真的死了,那這個機制會讓/127.0.0.3已死的狀態最終在ring裡所有的node間得到一致的結果。但是這時侯 node 2其實還是記著 /127.0.0.3,要再過了一段時間,(例子中是30秒,實際上會是 QUARANTINE_DELAY 除以2),如果 /127.0.0.3 還是一直沒消息,那 node 2就會把他從已知的node 列表刪掉,並印出以下的log:

INFO 20yy-MM-dd hh:mm:ss,SSS FatClient /127.0.0.3 has been silent for 30000ms, removing from gossip

那在我們的情境中,為什麼node C會一直出現同樣的訊息呢? 主要是因為情境中 node D曾經連上過 node A, B,因此在 A跟B的心裡,一直有node D的某個版本的資料(版號大於0),而node C重開後則從來沒連上過 D,所以C會一直重覆這個過程:收到A跟B傳來的D的某版本的資料,然後將他加入心中的ring,接著再發現D其實連不上,所以再把他移除。此時,若將A跟B重啟的話,C就不會再出現那些log。

看起來重啟解決了問題,但是接著我們會發現,從JMX的 org.apache.cassandra.net:type=FailureDetector 的attribute裡, D其實還是被知道的,只是被mark Down而以,如圖2:


圖2. /127.0.0.4 其實還沒完全消失

之所以會這樣是因為D的資訊已經被persistent了,cassandra會對ring的狀態做一定程度的persistent,這樣重啟node可以更快開始服務。這些persistent起來的資料就會存在system table的 LocationInfo裡,每次cassandra initial時,會從LocationInfo裡讀取被存起來的endpoint資訊,不過在initial時讀的endpoint的generation跟version都會是0,以圖1中的例子,/127.0.0.5就是initial時從LocationInfo裡讀到的,而從流程中可以知道,如果它一直沒再連回來的話,這個 endpoint的資訊並不會被散布出去。若要徹底的將這個node從ring中踢除(不讓他連上來的情況),那就要把LocationInfo也清除。

= 總結 =
其實這件事情會這麼麻煩,主要是因為我們沒法用正確的方式將node D從ring中移除,這是因為node D本來不是這個ring的一份子,為了怕資料進一步髒掉,我們不能讓他重新加回來,再用正規的手段去把他從ring中移掉。另一方面,在了解 gossip之後,才發現以前對那些log訊息的認知其實跟實際的情形是有落差的,那些log並不代表兩個node真的已經連線了……不過以我們遇到的情況,至少可以知道那些訊息是無害的。

PS. 在 CASSANDRA-3736 中,他們的解法是在replace node時,去system table將該endpoint移掉,如此一來,重開之後,那個node就會被眾人所遺忘,但是這個移除的的條件在後來的更動又有一些改變了,導至這個問題後來又重現,不過似乎沒發現後來有人再提起這些,不知道是不是後來的cassandra已經不會有問題了。

2014-06-16

Java Performance Monitoring

Book


Addison Wesley - Java Performance (2012)
Chapter 4 - Java Performance Monitoring 


需要被關注的 GC 資料

  • 目前使用的 Garbage collector
  • Java heap 的大小
  • The young/old/permanent generation 空間大小
  • Minor/Full GC 的周期、頻率、回收情況
  • GC 之前與之後,Java heap 使用情況
  • GC 之前與之後,young/old/permanent generation 使用情況
  • Old 和 Permanent generation 空間不足時,都會觸發 full GC
  • Java 應用程式是否呼叫了 System.gc()

GC 報告

  • 在預設的行為下,Full GC 會同時釋放 young/old/permanent generation 的空間。好處是,可以利用少量的 GC 工作去回收很多在 young generation 的物件,這樣一來 old generation 原本參考 young generation 物件的物件,就會解除參考關係,就能夠沒有牽掛的被回收。
  • 「-XX:-ScavengeBeforeFullGC」可以關閉 Full GC 時,也進行 Minor GC的行為。
  • 「-XX:+PrintGCDetails」可以用來列印 GC 資訊。
  • GC 資訊:
    (一)Throughput 垃圾回收器的 minor GC,log 如下:
    [GC
        [PSYoungGen: 99952K->14688K(109312K)]
        422212K->341136K(764672K), 0.0631991 secs]
        [Times: user=0.83 sys=0.00, real=0.06 secs]
    1. GC 標籤表示這是一個 minor GC
    2. PSYoungGen 表示是一個使用 throughput collector 的 多執行緒 young generation garbage collector,格式與解釋如下:
       GC 種類 GC前
       佔用空間

       GC後
       佔用空間
       young generation
       總容量 
       PSYoungGen: 99952K-> 14688K (109312K)
    3. 「+XX:+UseParallelGC」或「+XX:+UseParallelOldGC」可以啟動 PSYoungGen。
    4. 422212K->341136K(764672K), 0.0631991 secs,這行資訊代表在 GC 前後 Java heap 的使用狀況,格式與解釋如下:
      GC 前
       Java heap 被佔用大小
        GC 後
       Java heap 被佔用大小
       Java heap
       總容量
       GC 運行時間
       422212K -> 341136K (764672K)  , 0.0631991 secs
    5. Old generation 空間的計算:Java heap 總容量 - young generation 總容量
                                                  764672K - 109312K = 655360K
    6. [Times: user=0.83 sys=0.00, real=0.06 secs]user 是與OS無關,單純 GC 所花的 CPU 時間;sys 是代表 OS 使用代表 GC 指令所花的 CPU 時間;real 是 GC 運行時,真正時鐘的時間,以秒為單位,四捨五入到小數第二位。


    (二)Throughput 垃圾回收器的 full GC
    [Full GC
        [PSYoungGen: 11456K->0K(110400K)]
        [PSOldGen: 651536K->58466K(655360K)]
        662992K->58466K(765760K)
        [PSPermGen: 10191K->10191K(22528K)],
        1.1178951 secs]
        [Times: user=1.01 sys=0.00, real=1.12 secs]
    1. Full GC 標籤表示這是一個 full GC
    2. PSYoungGen 同(一)解釋
    3. PSOldGen 表示是一個使用 throughput collector 的 多執行緒 old generation garbage collector,格式與解釋如下:
       GC 種類 GC前
       佔用空間

       GC後
       佔用空間
       young generation
       總容量 
       PSOldGen: 651536K-> 58466K (655360K)
    4. 「+XX:+UseParallelOldGC」可以啟動 PSOldGen。
    5. 662992K->58466K(765760K) 代表 Java heap 的使用率,這是 young 和 old generation 空間在 GC 前後所共同累積的使用量。
    6. [PSPermGen: 10191K->10191K(22528K)] 代表 Permanent generation 空間的資訊,格式與解釋如下:
      GC 種類 GC前
      佔用空間

       GC後
      佔用空間
       Permanent generation  總容量
       PSPermGen: 10191K-> 10191K (22582K)
    7. 「+XX:+UseParallelGC」或「+XX:+UseParallelOldGC」可以啟動 PSPermGen。
    8. 1.1178951 secs 代表 GC 運行的時間。
    9. 最後一行,提供 CPU 時間與運行時間的資訊,同(一)解釋。

    (三)CMS GC 生命週期
    [GC
        [1 CMS-initial-mark: 13991K(773376K)]
        14103K(773376K), 0.0023781 secs]
        [Times: user=0.00 sys=0.00, real=0.00 secs]
    [CMS-concurrent-mark-start]
    [GC
        [ParNew: 2077K->63K(2112K), 0.0126205 secs]
        17552K->15855K(773376K), 0.0127482 secs]
        [Times: user=0.01 sys=0.00, real=0.01 secs]
    [CMS-concurrent-mark: 0.267/0.374 secs]
        [Times: user=4.72 sys=0.01, real=0.37 secs]
    [GC
        [ParNew: 2111K->64K(2112K), 0.0190851 secs]
        17903K->16154K(773376K), 0.0191903 secs]
        [Times: user=0.01 sys=0.00, real=0.02 secs]
    [CMS-concurrent-preclean-start]
    [CMS-concurrent-preclean: 0.044/0.064 secs]
        [Times: user=0.11 sys=0.00, real=0.06 secs]
    [CMS-concurrent-abortable-preclean-start]
    [CMS-concurrent-abortable-clean] 0.031/0.044 secs]
        [Times: user=0.09 sys=0.00, real=0.04 secs]
    [GC
        [YG occupancy: 1515 K (2112K)
        [Rescan (parallel) , 0.0108373 secs]
        [weak refs processing, 0.0000186 secs]
        [1 CMS-remark: 16090K(20288K)]
        17242K(773376K), 0.0210460 secs]
        [Times: user=0.01 sys=0.00, real=0.02 secs]
    [GC
        [ParNew: 2112K->63K(2112K), 0.0716116 secs]
        18177K->17382K(773376K), 0.0718204 secs]
        [Times: user=0.02 sys=0.00, real=0.07 secs]
    [CMS-concurrent-sweep-start]
    [GC
        [ParNew: 2111K->63K(2112K), 0.0830392 secs]
        19363K->18757K(773376K), 0.0832943 secs]
        [Times: user=0.02 sys=0.00, real=0.08 secs]
    [GC
        [ParNew: 2111K->0K(2112K), 0.0035190 secs]
        17527K->15479K(773376K), 0.0036052 secs]
        [Times: user=0.00 sys=0.00, real=0.00 secs]
    [CMS-concurrent-sweep: 0.291/0.662 secs]
        [Times: user=0.28 sys=0.01, real=0.66 secs]
    [GC
        [ParNew: 2048K->0K(2112K), 0.0013347 secs]
        17527K->15479K(773376K), 0.0014231 secs]
        [Times: user=0.00 sys=0.00, real=0.00 secs]
    [CMS-concurrent-reset-start]
    [CMS-concurrent-reset: 0.016/0.016 secs]
        [Times: user=0.01 sys=0.00, real=0.02 secs]
    [GC
        [ParNew: 2048K->1K(2112K), 0.0013936 secs]
        17527K->15479K(773376K), 0.0014814 secs]
        [Times: user=0.00 sys=0.00, real=0.00 secs]
    1. CMS 生命週期從 initial mark(CMS-initial-mark)階段開始,一直到 concurrent reset(CMS-concurrent-reset)結束。
    2. CMS-concurrent-mark 代表 concurrent mark 階段結束
    3. CMS-concurrent-sweep 代表 concurrent sweep 階段結束
    4. CMS-concurrent-preclean 和 CMS-concurrent-abortable-preclean 代表標示了一個可以併行且準備好要執行 remake 階段的工作。
    5. CMS-concurrent-reset 代表 CMS 已經完成,可以準備下一次的 CMS GC。
    6. 觀察 CMS-concurrent-sweep-start 和 CMS-concurrent-sweep 之間所進行的 minor GC 資訊,就可以知道 Java heap 有多少空間被釋放了。如果 Java heap 只有被釋放一點點,代表 "浪費了 CPU 去回收一點點物件" 或是 "物件被提升到 old generation 空間的速率等於或大於 CMS concurrent sweep 階段回收物件的速率",可以用這個觀察點來進行調效。
    7. 「-XX:+PrintTenuringDistribution」,tenuring distribution 是一個用來顯示 young generation 空間中,survivor 區域內物件的年紀,當一個物件年紀超過了年老閥值(tenuring threshold),它就會從 young generation 空間提升到 old generation 空間。
    8. 如果物件太快被提升到 old generation 空間,CMS garbage collector 就無法保持一定的速率進行 GC,這樣會導致 old generation 沒有足夠空間容納從 young generation 提升過來的物件而導致 "concurrent mode failure" 。這樣也會更容易讓 old generation 的空間變得更加破碎,所以 JVM 遇到這種情況,就會進行 full GC,把破碎的空間進行壓實(compacting),而這個操作是非常耗時的,被暫停的執行緒也必須等待更久的時間。可以注意 GC 報告裡,是否有 "concurrent mode failure" 的訊息,如果有就要判斷是不是應該調整

Date 和 Time stamps

  • 「-XX:+PrintGCTimeStamps」可以在每次 GC 報告中印出 time stamp。time stamp 表示 JVM 啟動後所經過的秒數,與「-XX:+PrintGCDetails」一起使用。
    77.233: [GC
        [PSYoungGen: 99952K->14688K(109312K)]
        422212K->341136K(764672K), 0.0631991 secs]
        [Times: user=0.83 sys=0.00, real=0.06 secs]
    在 GC 標籤前面帶有 time stamp。
  • 「-XX:+PrintGCDateStamps」在 Java 6 update 4 以後有提供,格式如下:
    『YYYY-MM-DD-T-HH-MM-SS-mmm』
    2010-11-21T09:57:10.518-0500:[GC
        [PSYoungGen: 99952K->14688K(109312K)]
        422212K->341136K(764672K), 0.0631991 secs]
        [Times: user=0.83 sys=0.00, real=0.06 secs]
  • 「-Xloggc:<filename>」可以將 GC 報告導到檔案,這樣就可以進行離線分析,同樣需要跟「-XX:+PrintGCDetails」一起使用。


Application Stopped Time and Concurrent Time

  • 「-XX:+PrintGCApplicationConcurrentTime」和「-XX:+PrintGCApplicationStoppedTime」可以得知 safepoint 操作間的運作時間和 Java 執行緒被阻塞的時間。觀察 safepoint 的延遲事件可以用來判斷這個操作對 JVM 的衝擊。
    Application time: 0.5279058 seconds
    [GC
        [ParNew: 4032K->64K(4032K), 0.0447854 secs]
        10154K->8648K(32704K), 0.0449156 secs]
        [Times: user=0.01 sys=0.00, real=0.04 secs]
    Total time for which application threads were stopped: 0.0453124 seconds
    Application time: 0.9063706 seconds
    [GC
        [ParNew: 4032K->64K(4032K), 0.0464574 secs]
        12616K->11187K(32704K), 0.0465921 secs]
        [Times: user=0.01 sys=0.00, real=0.05 secs]
    Total time for which application threads were stopped: 0.0470484 seconds

    當你看到 "Application time:" 和 "Total time for which application threads where stopped:" 就表示進行了 safepoint 操作。

    以上報告說明了,程式運行的時間大約花了 0.53秒~0.91秒,而 minor GC 大約花了 0.045秒~0.047秒,表示應用程式大約花了 5%~8% 的時間進行 minor GC。


JIT Compiler

  • 「-XX:+PrintCompilation」可以用來監控 HotSpot JIT compiler 的活動,會輸出類似已下的報告:
    7 java.lang.String::indexOf (151 bytes)
    8% ! sun.awt.image.PNGImageDecoder::produceImage @ 960 (1920 bytes)
    9 ! sun.awt.image.PNGImageDecoder::produceImage (1920 bytes)
    10 java.lang.AbstractStringBuilder::append (40 bytes)
    11 n java.lang.System::arraycopy (static)
    12 s java.util.Hashtable::get (69 bytes)
    13 b java.util.HashMap::indexFor (6 bytes)
    14 made zombie java.awt.geom.Path2D$Iterator::isDone (20 bytes)
    其格式是:<id> <type> <method name> [bci] <(# of bytes)>

        id: compile id
        type: none 或 以下之一:
                 % (osr)、
                 * | n (native method)、
                 s (synchronized method)、
                 ! (method has exception handler)、
                 b (interpreter blocked)、
                 1 (compile without full optimization),
                 made zombie (compile method no longer valid),
                 made not entrant (method deoptimized)
        bci: @ ## 為 osr 編譯器的 bytecode index
        # of bytes: 方法 bytecode 的 bytes 數


Class Loading

  • HotSpot VM 會載入在 permanent generation space 內所有類別的metadata。
  • 因為只要 permanent generation 空間滿了,HotSpot 就會啟動 full GC ,因此,監控類別載入活動和 permanent generation 空間的使用率是非常重要的。
  • full GC 報告中會顯示類別被卸載的情況:
    [Full GC
        [Unloading class sun.reflect.GeneratedConstructorAccessor3]
        [Unloading class sun.reflect.GeneratedConstructorAccessor8]
        [Unloading class sun.reflect.GeneratedConstructorAccessor11]
        [Unloading class sun.reflect.GeneratedConstructorAccessor6]
        8566K->5871K(193856K), 0.0989123 secs]
    報告中指出,有四個類別被卸載 (Uloading),底下的空間釋放也許 permanent generation 空間需要大一些喔!
  • 「-XX: PermSize」指定 permanent generation 空間的初始大小
  • 「-XX: MaxPermSize」指定 permanent generation 空間的最大容量
  • 為了要避免 full GC 讓 permanent generation 的 committed 空間有放大或縮小的可能,最好將 PermSize 和 MaxPermSize 設成一樣大。


Java Application Monitoring

  • 應用程式等級的監控,通常會使用 log 來觀察效能,但有一些應用程式會內件使用 MBean 來監控。
  • Quick Lock Contention Monitoring
    1. 「jstack」命令,可以用來截取 thread dumps,以觀察目前是否有鎖的競爭。報告顯示如下:

      ”Read Thread-33” prio=6 tid=0x02b1d400 nid=0x5c0 runnable
      [0x0424f000..0x0424fd94]
          java.lang.Thread.State: RUNNABLE
              at Queue.dequeue(Queue.java:69)
              - locked <0x22e88b10> (a Queue)
              at ReadThread.getWorkItemFromQueue(ReadThread.java:32)
              at ReadThread.run(ReadThread.java:23)


      ”Writer Thread-29” prio=6 tid=0x02b13c00 nid=0x3cc waiting for monitor
      entry [0x03f7f000..0x03f7fd94]
          java.lang.Thread.State: BLOCKED (on object monitor)
              at Queue.enqueue(Queue.java:31)
              - waiting to lock <0x22e88b10> (a Queue)
              at WriteThread.putWorkItemOnQueue(WriteThread.java:54)
              at WriteThread.run(WriteThread.java:47)


      ”Writer Thread-26” prio=6 tid=0x02b0d400 nid=0x194 waiting for monitor
      entry [0x03d9f000..0x03d9fc94]
          java.lang.Thread.State: BLOCKED (on object monitor)
              at Queue.enqueue(Queue.java:31)
              - waiting to lock <0x22e88b10> (a Queue)
              at WriteThread.putWorkItemOnQueue(WriteThread.java:54)
              at WriteThread.run(WriteThread.java:47)


      ”Read Thread-23” prio=6 tid=0x02b08000 nid=0xbf0 waiting for monitor entry
      [0x03c0f000..0x03c0fb14]
          java.lang.Thread.State: BLOCKED (on object monitor)
              at Queue.dequeue(Queue.java:55)
              - waiting to lock <0x22e88b10> (a Queue)
              at ReadThread.getWorkItemFromQueue(ReadThread.java:32)
              at ReadThread.run(ReadThread.java:23)
      執行緒 Thread-33 成功獲得共享佇列鎖 (Shared queue lock) ,這個鎖被標示成:- locked <0x22e88b10> (a Queue)

      其他的執行緒,正在等待同樣的鎖(位址一樣): - waiting to lock <0x22e88b10> (a Queue)
    2. 如果鎖的位址在堆疊追踪裡是不同的,就表示執行緒不是在競爭同樣的鎖。


Graphical Tools

JConsole
  • 發佈在 Java 5 之後的 JDK。
  • 應用程式啟動時必須加上 "-Dcom.sun.management.jmxremote" 屬性,若沒有,JConsole 連入時看到的應用程式會是灰色的。JDK 6 之後的版本不需要加這個屬性。
  • 要進行遠端監控應用程式,在應用程式啟動時必須加上 "-Dcom.sun.management.port" 以及 "-Dcom.sun.management.ssl" 。
  • JConsole 最有的是 heap memory 的圖形化分析報告,可以用來觀察一段時間裡 JVM 記憶體的使用狀況。
  • JConsole 定義 heap 是由 eden space、survivor space、old/tenured generation space 所組成。Non-heap 是由 permanent generaion space 和 code cache 組成。

    上面 5 個長條圖,依序是 old gen / eden space / survivor space / code cache / perm gen
  • JVM 記憶體衡量指標

    Used:目前記憶體使用量,包含 "reachable" 和 "unreachable"。
    Committed:JVM 保證還可以使用的空間,永遠大於 Used。
    Max:目前記憶體還可以被使用的量,JVM 若要增加記憶體用量,一但增加超過這個值,記憶體配置就會失敗。
    GC time:每一次 GC 的生命週期和暫停所累積的時間,會有很多行。


VisualVM
  • 發佈在 Java 6 update 7 JDK,表示啟動必須要 JDK 6。
  • 另快,可以下載獨立版本:http://visualvm.dev.java.net
  • 選單的三個節點:Local、Remote、Snapshots
    1. Local 節點:VisualVM 會自動偵測本地端的 Java 應用程式,並加到 Local 清單中。
    2. Remote 節點:偵測遠端主機裡,可被監控的 Java 應用程式,並加到 Remote 清單中。Java 應用程式可以透過兩種方式提供 VisualVM 連接:
      方式
      步驟
      jstatd daemon
      (1)    建立權限原則檔
      grant codebase "file:${java.home}/../lib/tools.jar" {
         permission java.security.AllPermission;
      };


      (2)    啟動 jstatd 並指定要使用的 port 和權限原則檔
      JAVA_HOME/bin/jstatd -p 1199 -J-Djava.security.policy=jstatd.all.policy

      (3)    透過 jps 連入遠端 jstatd daemon 以監控應用程式
      JMX
      (1)    啟動時加入 system properties
      -Dcom.sun.management.jmxremote.authenticate=<true/false>
      -Dcom.sun.management.jmxremote.ssl=<true/false>
      -Dcom.sun.management.jmxremote.port=<number>
      (2)    啟動 JVM
      (3)    檢查 port 是否已經打開並在偵聽
    3. Snapshots 節點:Java 應用程式狀態的 shapshot 檔案清單。
  • Threads 視窗的功用
    1. 執行緒的顏色代表:running/sleeping/blocked/waiting/contenting on a monitor lock。
    2. 可用來觀察哪些執行緒最活躍?哪些執行緒在競爭鎖。
    3. 可以獲得 thread dump 的資訊。
    4. 可以 profiling 並存成 snapshot,供其他開發人員討論。遠端應用程式只能進行 CPU profiling,而本地端應用程式則能進行 CPU 與 Memory profiling。
    5. 載入 binary heap dumps 功能,則可以載入由 JConsole、jmap 或是由「-XX:+HeapDumpOnOutOfMemoryError」鎖產生的 heap dump。

2014-06-08

如何讓 spring-mvc 關閉 chunked 回應

最近使用 spring-mvc 回傳 json 格式資料,發現它總是以 chunked 的方式回應資料給客戶端,對此感到好奇,想嘗試關閉這個選項,才發現這並不容易,因為它並不是個選項。

基於挑戰心態,還是實作了某種解法:
  1. 首先建立一個自己的 JacksonHttpMessageConverter 實作。
  2. 在載入階段更換預載的 MappingJacksonHttpMessageConverter 實例。
  3. 完成。


以下這段 xml 是在描述 spring 載入 mvc 時的設置:
  <mvc:annotation-driven/>
  <bean class="funweb.spring.JsonHackProcessor"/>

JsonHackProcessor 實作

package funweb.spring;

import java.util.ArrayList;
import org.springframework.beans.BeansException;
import org.springframework.beans.factory.config.BeanPostProcessor;
import org.springframework.http.converter.HttpMessageConverter;
import org.springframework.http.converter.json.MappingJacksonHttpMessageConverter;
import org.springframework.web.servlet.mvc.annotation.AnnotationMethodHandlerAdapter;

public class JsonHackProcessor implements BeanPostProcessor {

    public Object postProcessBeforeInitialization(Object bean, String beanName) throws BeansException {
        return bean;
    }

    public Object postProcessAfterInitialization(Object bean, String beanName) throws BeansException {
        if (bean instanceof AnnotationMethodHandlerAdapter) {
            AnnotationMethodHandlerAdapter adapter = (AnnotationMethodHandlerAdapter) bean;
            HttpMessageConverter<?>[] converters = adapter.getMessageConverters();

            ArrayList<HttpMessageConverter<?>> list = new ArrayList<>();
            for (HttpMessageConverter<?> converter : converters) {
                if (converter instanceof MappingJacksonHttpMessageConverter) {
                    list.add(new JacksonHttpMessageConverter());
                    continue;
                }
                list.add(converter);
            }

            converters = list.toArray(converters);
            adapter.setMessageConverters(converters);
        }
        return bean;
    }

}
大致上的做法是透過 AnnotationMethodHandlerAdapter 類別取出預載的 MessageConverter 實例陣列,其中一個會是 MappingJacksonHttpMessageConverter 實例,將它替換成我們的實例即可。


JacksonHttpMessageConverter 實作

package funweb.spring;

import java.io.*;
import java.nio.charset.Charset;
import java.util.*;
import org.apache.commons.io.IOUtils;
import org.codehaus.jackson.*;
import org.codehaus.jackson.map.ObjectMapper;
import org.codehaus.jackson.map.type.TypeFactory;
import org.codehaus.jackson.type.JavaType;
import org.springframework.http.*;
import org.springframework.http.converter.*;

public class JacksonHttpMessageConverter implements HttpMessageConverter<Object> {

    private static final Charset DEFAULT_CHARSET = Charset.forName("UTF-8");
    private final MediaType supportedMediaType = new MediaType("application", "json", DEFAULT_CHARSET);
    private final List<MediaType> supportedMediaTypes = Collections.unmodifiableList(Collections.singletonList(supportedMediaType));
    private ObjectMapper objectMapper = new ObjectMapper();

    @Override
    public boolean canRead(Class<?> clazz, MediaType mediaType) {
        JavaType javaType = getJavaType(clazz);
        return this.objectMapper.canDeserialize(javaType) && canRead(mediaType);
    }

    protected boolean canRead(MediaType mediaType) {
        if (mediaType == null) {
            return true;
        }
        return supportedMediaType.includes(mediaType);
    }

    @SuppressWarnings("deprecation")
    protected JavaType getJavaType(Class<?> clazz) {
        return TypeFactory.type(clazz);
    }

    @Override
    public boolean canWrite(Class<?> clazz, MediaType mediaType) {
        return this.objectMapper.canSerialize(clazz) && canWrite(mediaType);
    }

    protected boolean canWrite(MediaType mediaType) {
        if (mediaType == null || MediaType.ALL.equals(mediaType)) {
            return true;
        }
        return supportedMediaType.isCompatibleWith(mediaType);
    }

    @Override
    public List<MediaType> getSupportedMediaTypes() {
        return this.supportedMediaTypes;
    }

    @Override
    public Object read(Class<? extends Object> clazz, HttpInputMessage inputMessage) throws IOException, HttpMessageNotReadableException {
        JavaType javaType = getJavaType(clazz);
        try {
            return this.objectMapper.readValue(inputMessage.getBody(), javaType);
        }
        catch (JsonParseException ex) {
            throw new HttpMessageNotReadableException("Could not read JSON: " + ex.getMessage(), ex);
        }
    }

    @Override
    public void write(Object o, MediaType contentType, HttpOutputMessage outputMessage) throws IOException, HttpMessageNotWritableException {

        HttpHeaders headers = outputMessage.getHeaders();
        if (headers.getContentType() == null) {
            if (contentType == null || contentType.isWildcardType() || contentType.isWildcardSubtype()) {
                contentType = supportedMediaType;
            }
            if (contentType != null) {
                headers.setContentType(contentType);
            }
        }

        ByteArrayOutputStream outStream = new ByteArrayOutputStream();
        JsonEncoding encoding = getEncoding(outputMessage.getHeaders().getContentType());
        JsonGenerator jsonGenerator = this.objectMapper.getJsonFactory().createJsonGenerator(outStream, encoding);
        try {
            this.objectMapper.writeValue(jsonGenerator, o);
            byte[] buff = outStream.toByteArray();
            headers.setContentLength(outStream.size());
            IOUtils.copy(new ByteArrayInputStream(buff), outputMessage.getBody());
        }
        catch (JsonGenerationException ex) {
            throw new HttpMessageNotWritableException("Could not write JSON: " + ex.getMessage(), ex);
        }

        outputMessage.getBody().flush();
    }

    private JsonEncoding getEncoding(MediaType contentType) {
        if (contentType != null && contentType.getCharSet() != null) {
            Charset charset = contentType.getCharSet();
            for (JsonEncoding encoding : JsonEncoding.values()) {
                if (charset.name().equals(encoding.getJavaName())) {
                    return encoding;
                }
            }
        }
        return JsonEncoding.UTF8;
    }

}
可別被上面這段程式碼給嚇著了,其實也不過是將原始的 MappingJacksonHttpMessageConverter.java 拿來塗改罷了,有興趣的人可以拿來比較看看,其實上面這個版本比較簡單;並突破了上層類別的限制。

2014-06-05

AMQ-4853 - ActiveMQ-5.9.0 吃滿 CPU 的問題

Warning

這篇文章提出來的 fix, 等於 patch ActiveMQ-5.8.0 的程式, 而不是 ActiveMQ-5.9.0 的程式.

Reference

Problem

ActiveMQ 從 5.5.1 升級到 5.9.0 之後過一個禮拜, 
ActiveMQ 把一台 server 的八核 CPU 都吃滿, 達到 100% 使用率. 
查 ActiveMQ-5.9.1 的 release note, 發現在 AMQ-4853 有在解相關的問題.

這個問題主要是說 ActiveMQ 在 5.9.0 有個修改. 這個修改的 comment 是:
Just use a concurrent linked queue, makes the code much simpler and
doesn't hurt performance overall
目的是為了讓程式變簡單, 理論上不影響效能. (不過看起來的確 hurt performance)

Reproduce

  1. 部屬 ActiveMQ 兩台 cluster (一台不容易重現)
  2. 執行程式去打 ActiveMQ
    package test;
    
    import java.util.Enumeration;
    import java.util.concurrent.ExecutorService;
    import java.util.concurrent.Executors;
    import java.util.concurrent.TimeUnit;
    
    import javax.jms.Connection;
    import javax.jms.JMSException;
    import javax.jms.QueueBrowser;
    import javax.jms.Session;
    import javax.jms.TextMessage;
    
    import org.apache.activemq.ActiveMQConnectionFactory;
    import org.junit.Test;
    
    public class OccupyCPUTest {
    
        @Test
        public void test() throws JMSException, InterruptedException {
            final ActiveMQConnectionFactory f1 = new ActiveMQConnectionFactory("tcp://192.168.0.1:61616");
            final ActiveMQConnectionFactory f2 = new ActiveMQConnectionFactory("tcp://192.168.0.2:61616");
            ExecutorService e = Executors.newCachedThreadPool();
            for ( int i = 0; i < 40; i++ ) {
                newRun(f1, e);
            }
            for ( int i = 0; i < 40; i++ ) {
                newRun(f2, e);
            }
            TimeUnit.DAYS.sleep(1);
        }
    
        protected void newRun(final ActiveMQConnectionFactory f, ExecutorService e) {
            e.execute(new Runnable(){
                @Override
                public void run() {
                    try {
                        Connection c = f.createConnection("id", "pwd");
                        c.start();
                        Session session = c.createSession(false, Session.AUTO_ACKNOWLEDGE);
                        while (true) {
                            QueueBrowser b = session.createBrowser(session.createQueue("test"), "key='val'");
                            Enumeration<textmessage> enumeration = b.getEnumeration();
                            while (enumeration.hasMoreElements()) {
                                enumeration.nextElement();
                            }        
                            b.close();
                            TimeUnit.MILLISECONDS.sleep(50);
                        }
                    } catch (Throwable ex) {
                        ex.printStackTrace();
                    }
                }});
        }
        
    }
    
  3. 用 jconsole 或 jvisualvm 監控兩台 ActiveMQ 的 CPU, 可以看到 CPU 慢慢往上升, 直到 100%

What Happened?

這個測試程式其實就是起 80個 thread, 每個 thread 每 50 millis 去 browse 一次 ActiveMQ.
而每次 browse message, ActiveMQ 都會建立內部的 consumer, browse 之後 ActiveMQ 又會 removeConsumer.

回到 AMQ-4853, 以前的 AdvisorySupport#removeConsumer 會從 ConcurrentSkipListMap put or remove ConsumerIdKey & ConsumerInfo. 注意 ConsumerIdKey 有保留 Consumer 進入的時間先後順序, 程式的 comment 提到:
// replay consumer advisory messages in the order in which they arrive - allows duplicate suppression in
// mesh networks with ttl>1
意思是說這段程式的目的是要確保 consumer 的 advisory message 會照順序的被發出去.
不過這樣的處理方式, 後來被覺得程式比較複雜, 所以直接將 ConcurrentSkipListMap 改為 ConcurrentLinkedQueue, 然後把一堆 ConsumerIdKey 的處理拿掉.

結果問題出現, 當 consumer 頻繁的上下線, 會造成 ConcurrentLinkedQueue#remove 被呼叫很多次, 造成 CPU 節節升高. 只要把 jvisualvm 打開 monitor 就可以發現 bottleneck 就在 #remove 這個 method 上.

當這個問題在 issue 上被提出來質疑 ConcurrentLinkedQueue 是個不好的做法時, 該 developer - Timothy Bish 認為 ActiveMQ 的使用者不該讓 consumer 太常上下線.
You should investigate why all the consumers are coming and going so often -Timothy Bish
最後有個 user 研究後發現 ConcurrentLinkedQueue<ConsumerInfo> 的 ConsumerInfo 沒有實作 equals & hashCode, 這樣會讓 ConcurrentLinkedQueue#remove 變很慢, 所以 Tim 就把這個 improvement 放到 trunk & 5.9.1. 結束 AMQ-4853.

ActiveMQ Classpath

我們使用 ActiveMQ 的 batch 檔開 ActiveMQ.
ActiveMQ 使用 wrapper service 起動, 起動方式會先載入 activemq.jar, 裡面有個 main class, 這個 class 會去載相關的 library.
把這個 main class decompile 後看到
app.addClassPathList(System.getProperty("activemq.classpath"));
看起來可以設定 activemq.classpath, 改了 AdvisoryBroker 後包成一個小 jar 檔, 然後在 wrapper.conf 裡面設定 -Dactivemq.classpath=${patch jar path}  就可以了.

Problem Fixed?

放上這個 issue 的 fix (就是實作 ConsumerInfo 的 equals & hashCode) 測一次, 效能比較好的那台機器似乎 CPU 維持平穩, 但比較差的那台機器就撐不過去.

我後來把 ConcurrentLinkedQueue 改為 ConcurrentHashMap 就可以通過測試.

Final

原本有點擔心 ConcurrentHashMap 的實作無法滿足 replay consumer advisory message 的需求, 不過查一下 ActiveMQ-5.8.0 的程式, 發現本來就是使用 ConcurrentHashMap. 看來 ConcurrentSkipListMap 與 ConcurrentLinkedQueue 都是在 ActiveMQ-5.9.0 加 & refactor 的.

在 ActiveMQ-5.9.0 把 ConcurrentHashMap 改為 ConcurrentSkipListMap & ConcurrentLinkedQueue 的原因是 AMQ-2327 - Consumers left hanging in the large network of brokers

在我們的 case 裡面, 還沒有那麼多台 ActiveMQ, 而且使用上也可以分成很多獨立的 ActiveMQ 使用, 看起來使用 ConcurrentHashMap 在我們的環境不會遇到 AMQ-2327 的 issue 才對. 所以最後我就選擇把 ConcurrentLinkedQueue 改回使用 ConcurrentHashMap 了.


2014-05-29

Java Performance - JVM Overview


Book


Addison Wesley - Java Performance (2012)
Chapter 3 - Java Performance Monitoring 


HotSpot VM High Level Architecture


Responsibility of HotSpot VM Runtime

  1. Parsing of command line arguments
  2. VM life cycle
  3. Class loading
  4. Byte code interpreter
  5. Exception handling
  6. Synchronization
  7. Thread management
  8. Java Native Interface
  9. VM fatal error handling
  10. C++ heap management

Command Line Options

  1. Standard Options
  2. Nonstandard Options :  start with「-X」
  3. Developer Options :
    format (一) : -XX:{+/-}{OptionName}
    format (二) : -XX:{OptionName}={Number}{k/m/g}

HotSpot VM Live Cycle

  1. Parse command line options
  2. Establish java heap and JIT compiler
  3. Establish Environment variable
  4. Use JNI_CreateJavaVM to create HotSpot VM
  5. Load Java Main-Class (or find from jar's manifest file)
  6. Pass command line arguments to Main-Class
  7. At finally, use JNI_DestroyJavaVM to shutdown HotSpot VM


HotSpot Class Loader

  1. A Class' phases of loading, linking, initializing.
  2. Class loading APIs
    • Class.forName()
    • ClassLoader.loadClass()
    • Reflection APIs
    • JNI_FindClass
  3. Parent class or interfaces need to load before child class.
  4. Class loader delegation.


Interpreter

  1. HotSpot VM is a template based interpreter.
  2. It  is not assembly, there are assembly libraries in it and use to compile bytecode to machine code.
  3. Use -XX:+PrintInterpreter to debug . But Don't use it in production environment.


Synchronization

  1. A mechanism that prevents, avoids, or recovers from the inopportune interleavings, commonly call "races".
  2. In Java, a monitor is either lock or unlock, and only one thread may own the monitor at any one time.
  3. In Java, critical section are referred to as synchronized blocks.
  4. Synchronization includes three locks: biased locking, cas locking(lightweight locking), heavyweight locking.
  5. Mark Word stores Java object synchronization states: Neutral, Biased,Stack-Locked, Inflated.


Thread Management

  1. Types of thread
    • java.lang.Thread represents a thread in Java code.
    • C++ JavaThread represents the java.lang.Thread instance and contains a pointer to java.lang.Thread. It also contains additional information to track the state of thread.
    • OSThread represents an OS thread and contains OS level information.
  2. When a java.lang.Thread is started the Hotspot VM creates the associated JavaThread, OSThread and native thread. When native threa is created and executes a startup method that leads to the execution of java.lang.Thread#run() method.
  3. In java.lang.Thread's constructor:
    • A native thread need to be attached to HotSpot VM via JNI_AttachCurrentThread.
    • JavaThread and OSThread will be created when invoke JNI_AttachCurrentThread.
    • Finally, java.lang.Thread is created for the attached thread.
  4. Internal VM Threads (C++ JavaThread)
    • VM thread
    • Periodic task thread
    • Garbage collection threads
    • JIT compile threads
    • Signal dispatcher thread

C++ heap management

  1. In addition to HotSpot java heap the HotSpot also uses a C/C++ heap for storage of HotSpot VM internal objects and data.
  2. Arena is used to manage the HotSpot VM C++ heap operations.
  3. Arena are thread-local objects that cache a amount of memory storage. This allow for fast-path allocation where a global shared lock is not required.


Java Native Interface

  1. It allow Java code that runs inside a JVM to interoperate with application an libraries written in other programming language, such as C, C++, assembly.
  2. If you use JNI, your application may lose two benefits of the Java Platform.
    • No more "write once, run anywhere"
    • Java programming language is a type-safe language and secure; native language such as C, C++ are not.
  3. Command line option: -Xcheck:jni can used to debug.


VM Fatal Error Handling

  1. A common VM fatal error is an OutOfMemoryError.
  2. HotSpot's error log: hs_err_pid<pid>.log contains some information.  A memory map is included in the hs_err_pid<pid>.log to make it is easy to see how memory is laid out during VM crash.
  3. Command line options:
    • -XX:ErrorFile=<path>
    • -XX:+ShowMessageBoxOnError
    • -XX:+HeapDumpOnOutOfMemoryError
    • -XX:+HeapDumpPath=<path>


Generational Garbage Collection

  1. The two weak generational hypothesis:
    • Most allocated object become unreachable quickly.
    • Few references from older to young object exist.
  2. The young generation: Most newly allocated objects are allocated in the young generation. It is typically small and collected frequently. In general, minor GC are efficient.
  3. The old generation: Objects that are longer-lived are eventually promoted, or tenured, to the old generation. It is typically larger than young generation, and its occupancy grows more slowly. In general, major GC are infrequent.
  4. The permanent generation: It should not be sees as part of the generation hierarchy. It is only used by the HotSpot VM itself to hold metadata, such as class data structure, interned strings, and so on.
  5. Because there is a "old-to-young" generation references and to keep minor GC short, HotSpot uses a data structure "Card table". How does minor GC work with card table? You can read page. 82~83 to get more information.


The Young Generation

  1. The Eden: This is where most new objects are allocationed. Eden is almost always empty after a minor GC.
  2. The two survivor spaces: Thes hold objects that have survived at least one minor GC.
  3. Used Survivor and unused survivor will swap roles at the end of the minor GC.
  4. Right illustrate shows the operation of a minor GC.After minor GC, the live objects are copied to the unused survivor space. Live objects which will be given another chance to be reclaimed in the young generation, are also copied to the unused survivor space. Finally, live objects that are deemed "old enough", are promoted to the old generation.


Types of Garbage Collectors

  1. The Serial GC
  2. The Parallel GC: Throughput Matters!
  3. The Mostly-Concurrent GC (CMS GC): Latency Matters!
  4. The Garbage-First GC (G1): CMS Replacement

The Serial GC
  1. Both minor and full GC take place in a stop-the-world fashion. Only after GC has finished is the application restarted.
  2. The young generation that operates as described earlier. The old generation managed by a sliding compacting mark-sweep (mark-compact GC). 
    • First, identifies which objects are still live in the old generation.
    • Then, slide them toward the beginning of the heap.
    • Leaving any free space in a single contiguous chunk at the end of the heap.
  3. Do not have low pause requirements and run on client-style machine.
  4. It takes advantage of only a single virtual processor of GC work.


The Parallel GC
  1. Both minor and full GC take place in a stop-the-world fashion. Only after GC has finished is the application restarted.
  2. It should take advantage of all available processor resources. To decrease GC overhead and hence increase application throughput on server-style machine.
  3. The Parallel GC, compared to the Serial GC, improves overall GC efficiency, and as a result improves application throughput.


The Mostly-Concurrent GC: Latency Matters!
  1. The Mostly-Concurrent GC, as known as the Concurrent Mark-Sweep GC.
  2. It manages its young generation the same way the Parallel and Serial GC.
  3. Its old generation is managed by an algorithm that performs most of its work concurrently, imposing only two short pauses per GC cycle.
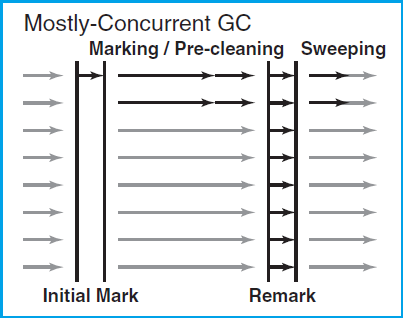
  4. Right illustrate shows a GC cycle.
    • It starts with a short pause "Initial Mark", that identifies the set of objects from old generation.
    • Then, during the concurrent marking phase, it mark all live objects from the set.
    • The use of pre-cleaning can reduce, sometimes dramatically, the number of objects that need to be visited during remark phase, it is very effective in reducing the duration of the remark pause.
    • The application is stopped again for second pause "Remark" which finalizes the marking information by revisiting any objects that were modified during the concurrent marking phase.
    • The final phase of GC cycle is the concurrent  sweeping phase, which sweeps over the java heap, deallocating garbage objects without relocating the live ones.
  5.  Compare to the Parallel GC, CMS decreases old-generation pause - sometimes dramatically - at the expense of slighly longer young generation pauses, some reduction in the thoughtput, extra heap size requirements.


The Garbage-First GC: CMS Replacement
  1. It is a parallel, concurrent and incrementally compacting low-pause GC intended to be the long-term replacement of CMS.
  2. It splits the Java heap into equal-sized chunks call "regions".
  3. Each generation is a set of regions. This allow G1 to resize the young generation in a flexible way.

Comparisons


2014-05-19

Linux Tunning when testing

# Managed by Jerry Meng

# Controls the size of the connection listening queue
net.core.somaxconn = 4096                 (default value: 128)

# Increase Linux autotuning TCP buffer limits
# Set max to 16M for 1GE and 32M (33554432) or 54M (56623104) for 10GE
net.core.rmem_max = 16777216
net.core.wmem_max = 16777216
net.ipv4.tcp_rmem = 4096 87380 16777216
net.ipv4.tcp_wmem = 4096 16384 16777216

# Make room for more TIME_WAIT sockets due to more clients,
# and allow them to be reused if we run out of sockets
# Also increase the max packet backlog
net.core.netdev_max_backlog = 50000       (default value: 1000)
net.ipv4.tcp_max_syn_backlog = 30000      (default value: 1024)
net.ipv4.tcp_max_tw_buckets = 2000000     (default value: 180000)
net.ipv4.tcp_tw_reuse = 1
net.ipv4.tcp_fin_timeout = 10

# Disable TCP slow start on idle connections
net.ipv4.tcp_slow_start_after_idle = 0

# Disable source routing and redirects
net.ipv4.conf.all.send_redirects = 0
net.ipv4.conf.all.accept_redirects = 0
net.ipv4.conf.all.accept_source_route = 0

# Log packets with impossible addresses for security
net.ipv4.conf.all.log_martians = 1

# Additional settings - these settings can improve the network
# security of the host and prevent against some network attacks
# including spoofing attacks and man in the middle attacks through
# redirection. Some network environments, however, require that these
# settings are disabled so review and enable them as needed.
#
# Do not accept ICMP redirects (prevent MITM attacks)
net.ipv4.conf.all.accept_redirects = 0
net.ipv6.conf.all.accept_redirects = 0

# _or_
# Accept ICMP redirects only for gateways listed in our default
# gateway list (enabled by default)
# net.ipv4.conf.all.secure_redirects = 1
#
# Do not send ICMP redirects (we are not a router)
net.ipv4.conf.all.send_redirects = 0


2014-05-15

心得: How not to use cassandra (下)


C* Summit 2013: How Not to Use Cassandra by Axel Liljencrantz
http://www.slideshare.net/planetcassandra/8-axel-liljencrantz-23204252

https://www.youtube.com/watch?v=0u-EKJBPrj8


<= How not to delete data =>

重點:
Tombstones can only be delete once all non-tombstone values have been deleted.
Tombstones can only be deleted if all values for the specified row are all being compacted

所以對於wide-row,minor compaction幾乎沒辦法回收tombstone

補充:
Size tiered compaction
預設的compaction strategy,原理是對N個(預設是4個)差不多大的SSTable做compaction,然後將這N個sstable merge成一個新的大SSTable(通常這個新的SSTable會變比較大)
由於這個原理,會造成越大的SSTable compaction的機率越低

Leveled Compaction
給SSTable 分層,不同層的SSTable大小會程等比級數的上升,預設是10倍大,ex: L0 5MB, L1 50MB, L2 500MB
L0預設是5MB
L0到5MB時,就會compact,並把超出大小的部份跟跟L1 merge
當L1超出50MB時,會compact並把超出50MB的部份merge進L2…依此類推
理論上大部份的row會在一個SSTable裡(理論上90%,但是實際上可能只有50~80%


相較於Size tiered compaction,更適合
-需要較低的讀取延遲
-讀多寫少
-wide-row or rows are frequently updated

不適合以下情況
-機器IO不行
-寫多讀少
-資料寫入之後不再更新


TTL:ed data =

重點:
Overwritten data could theoretically bounce back
如果TTLed data 去覆寫掉另一個column的值,當TTLed data expired,當舊的data還沒被compaction之前,他就會再跑出來

補充
-TTLed data and compaction
  
-CASSANDRA-3442 TTL histogram for sstable metadata (for size tiered compaction)
CASSANDRA-4234  Add tombstone-removal compaction to LCS (Cassandra 1.2.0 b1)
cassandra 1.2,  Cassandra tracks tombstone droppable time for all TTLed/deleted columns and performs standalone compaction onto an SSTable that has droppable tombstones ratio against all columns above certain threshold. The threshold has default value of 20% or 0.2, and you can configure threshold by providing compaction parameter tombstone_threshold when creating column family.

The histogram looks like this:

table options:
  • tombstone_compaction_interval
tombstone_compaction_interval && count > tombstone_threshold, then cassandra will trigger a tombstone compaction.

  • tombstone_threshold
-if garbage-collectable column count > threshold(ratio), then the SSTable will  trigger a compaction to purging the tombstone (for the SSTable)
garbage-collectable means at least the data was out of gc_grace

-Cassandra-5228: Drop entire sstables when all columns are expired
Cassandra(2.0 b1)
a separate compaction strategy that doesn't bother merging sstables, just throws out expired ones


<= The playlist service =>


Tombstone hell =

重點:
expect tombstone would be deleted after 30days, but all tombstone since 1.5 years ago were there
Rows exist in 4+ SSTables, ts never del in minor compactions.

solution: use Major compaction
solution2: repairs during Monday-Friday, Major compaction in Saturday-Sunday

-> Dont use Cassandra to store queues

Cassandra counters =
Cassandra counters
Distributed counters > works pretty well


create a column family with default_validation_class=CounterColumnType

cli: keyspace.prepareColumnMutation(CF_COUNTER1, rowKey, "CounterColumn1").incrementCounterColumn(1).execute();

cql: UPDATE counters SET c1 = c1 + 3, c2 = c2 - 4 WHERE key = row2;


-For each write, only one of the replica has to perform a read, even with many replicas.
-- the read was part of the write, client will not observe.


-if sstable or disk corrupted, the counter cf should rebuild. (cant repair)
-Counter column與非counter的column不能共存 https://issues.apache.org/jira/browse/CASSANDRA-2614
-no TTL for counter column
-couner的remove有些許限制,如果只是要重置counter的話,快速的 incr-delete-incr 可能會讓delete被略過,比較適合的用法是減掉current value
delete最好只用來永久性的刪除某筆counter
-假設Counter的寫入timeout了,client並沒辦法確定counter是不是真的寫入成功(client不能單純地重新寫入,因為根本不知道資料到底有沒有寫成功,多寫了會造成重覆計算)