
Book
Addison Wesley - Java Performance (2012)
Chapter 3 - Java Performance Monitoring
Chapter 3 - Java Performance Monitoring
HotSpot VM High Level Architecture

Responsibility of HotSpot VM Runtime
- Parsing of command line arguments
- VM life cycle
- Class loading
- Byte code interpreter
- Exception handling
- Synchronization
- Thread management
- Java Native Interface
- VM fatal error handling
- C++ heap management
Command Line Options
- Standard Options
- Nonstandard Options : start with「-X」
- Developer Options :
format (一) : -XX:{+/-}{OptionName}
format (二) : -XX:{OptionName}={Number}{k/m/g}
HotSpot VM Live Cycle
- Parse command line options
- Establish java heap and JIT compiler
- Establish Environment variable
- Use JNI_CreateJavaVM to create HotSpot VM
- Load Java Main-Class (or find from jar's manifest file)
- Pass command line arguments to Main-Class
- At finally, use JNI_DestroyJavaVM to shutdown HotSpot VM
HotSpot Class Loader
- A Class' phases of loading, linking, initializing.
- Class loading APIs
- Class.forName()
- ClassLoader.loadClass()
- Reflection APIs
- JNI_FindClass
- Parent class or interfaces need to load before child class.
- Class loader delegation.
Interpreter
- HotSpot VM is a template based interpreter.
- It is not assembly, there are assembly libraries in it and use to compile bytecode to machine code.
- Use -XX:+PrintInterpreter to debug . But Don't use it in production environment.
Synchronization
- A mechanism that prevents, avoids, or recovers from the inopportune interleavings, commonly call "races".
- In Java, a monitor is either lock or unlock, and only one thread may own the monitor at any one time.
- In Java, critical section are referred to as synchronized blocks.
- Synchronization includes three locks: biased locking, cas locking(lightweight locking), heavyweight locking.
- Mark Word stores Java object synchronization states: Neutral, Biased,Stack-Locked, Inflated.
Thread Management
- Types of thread
- java.lang.Thread represents a thread in Java code.
- C++ JavaThread represents the java.lang.Thread instance and contains a pointer to java.lang.Thread. It also contains additional information to track the state of thread.
- OSThread represents an OS thread and contains OS level information.
- When a java.lang.Thread is started the Hotspot VM creates the associated JavaThread, OSThread and native thread. When native threa is created and executes a startup method that leads to the execution of java.lang.Thread#run() method.
- In java.lang.Thread's constructor:
- A native thread need to be attached to HotSpot VM via JNI_AttachCurrentThread.
- JavaThread and OSThread will be created when invoke JNI_AttachCurrentThread.
- Finally, java.lang.Thread is created for the attached thread.
- Internal VM Threads (C++ JavaThread)
- VM thread
- Periodic task thread
- Garbage collection threads
- JIT compile threads
- Signal dispatcher thread
C++ heap management
- In addition to HotSpot java heap the HotSpot also uses a C/C++ heap for storage of HotSpot VM internal objects and data.
- Arena is used to manage the HotSpot VM C++ heap operations.
- Arena are thread-local objects that cache a amount of memory storage. This allow for fast-path allocation where a global shared lock is not required.
Java Native Interface
- It allow Java code that runs inside a JVM to interoperate with application an libraries written in other programming language, such as C, C++, assembly.
- If you use JNI, your application may lose two benefits of the Java Platform.
- No more "write once, run anywhere"
- Java programming language is a type-safe language and secure; native language such as C, C++ are not.
- Command line option: -Xcheck:jni can used to debug.
VM Fatal Error Handling
- A common VM fatal error is an OutOfMemoryError.
- HotSpot's error log: hs_err_pid<pid>.log contains some information. A memory map is included in the hs_err_pid<pid>.log to make it is easy to see how memory is laid out during VM crash.
- Command line options:
- -XX:ErrorFile=<path>
- -XX:+ShowMessageBoxOnError
- -XX:+HeapDumpOnOutOfMemoryError
- -XX:+HeapDumpPath=<path>
Generational Garbage Collection

- The two weak generational hypothesis:
- Most allocated object become unreachable quickly.
- Few references from older to young object exist.
- The young generation: Most newly allocated objects are allocated in the young generation. It is typically small and collected frequently. In general, minor GC are efficient.
- The old generation: Objects that are longer-lived are eventually promoted, or tenured, to the old generation. It is typically larger than young generation, and its occupancy grows more slowly. In general, major GC are infrequent.
- The permanent generation: It should not be sees as part of the generation hierarchy. It is only used by the HotSpot VM itself to hold metadata, such as class data structure, interned strings, and so on.
- Because there is a "old-to-young" generation references and to keep minor GC short, HotSpot uses a data structure "Card table". How does minor GC work with card table? You can read page. 82~83 to get more information.
The Young Generation
- The Eden: This is where most new objects are allocationed. Eden is almost always empty after a minor GC.
- The two survivor spaces: Thes hold objects that have survived at least one minor GC.
- Used Survivor and unused survivor will swap roles at the end of the minor GC.
- Right illustrate shows the operation of a minor GC.After minor GC, the live objects are copied to the unused survivor space. Live objects which will be given another chance to be reclaimed in the young generation, are also copied to the unused survivor space. Finally, live objects that are deemed "old enough", are promoted to the old generation.

Types of Garbage Collectors
- The Serial GC
- The Parallel GC: Throughput Matters!
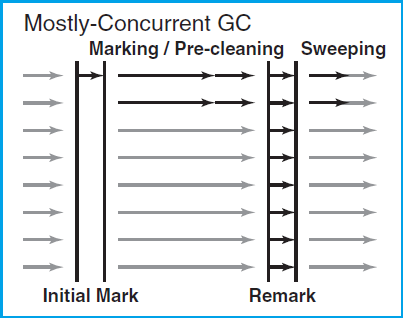
- The Mostly-Concurrent GC (CMS GC): Latency Matters!
- The Garbage-First GC (G1): CMS Replacement
- Both minor and full GC take place in a stop-the-world fashion. Only after GC has finished is the application restarted.
- The young generation that operates as described earlier. The old generation managed by a sliding compacting mark-sweep (mark-compact GC).
- First, identifies which objects are still live in the old generation.
- Then, slide them toward the beginning of the heap.
- Leaving any free space in a single contiguous chunk at the end of the heap.
- Do not have low pause requirements and run on client-style machine.
- It takes advantage of only a single virtual processor of GC work.
- Both minor and full GC take place in a stop-the-world fashion. Only after GC has finished is the application restarted.
- It should take advantage of all available processor resources. To decrease GC overhead and hence increase application throughput on server-style machine.
- The Parallel GC, compared to the Serial GC, improves overall GC efficiency, and as a result improves application throughput.
- The Mostly-Concurrent GC, as known as the Concurrent Mark-Sweep GC.
- It manages its young generation the same way the Parallel and Serial GC.
- Its old generation is managed by an algorithm that performs most of its work concurrently, imposing only two short pauses per GC cycle.
- Right illustrate shows a GC cycle.
- It starts with a short pause "Initial Mark", that identifies the set of objects from old generation.
- Then, during the concurrent marking phase, it mark all live objects from the set.
- The use of pre-cleaning can reduce, sometimes dramatically, the number of objects that need to be visited during remark phase, it is very effective in reducing the duration of the remark pause.
- The application is stopped again for second pause "Remark" which finalizes the marking information by revisiting any objects that were modified during the concurrent marking phase.
- The final phase of GC cycle is the concurrent sweeping phase, which sweeps over the java heap, deallocating garbage objects without relocating the live ones.
- Compare to the Parallel GC, CMS decreases old-generation pause - sometimes dramatically - at the expense of slighly longer young generation pauses, some reduction in the thoughtput, extra heap size requirements.
- It is a parallel, concurrent and incrementally compacting low-pause GC intended to be the long-term replacement of CMS.
- It splits the Java heap into equal-sized chunks call "regions".
- Each generation is a set of regions. This allow G1 to resize the young generation in a flexible way.

沒有留言 :
張貼留言